4.1.3 Production Run Monitoring
1. Overview
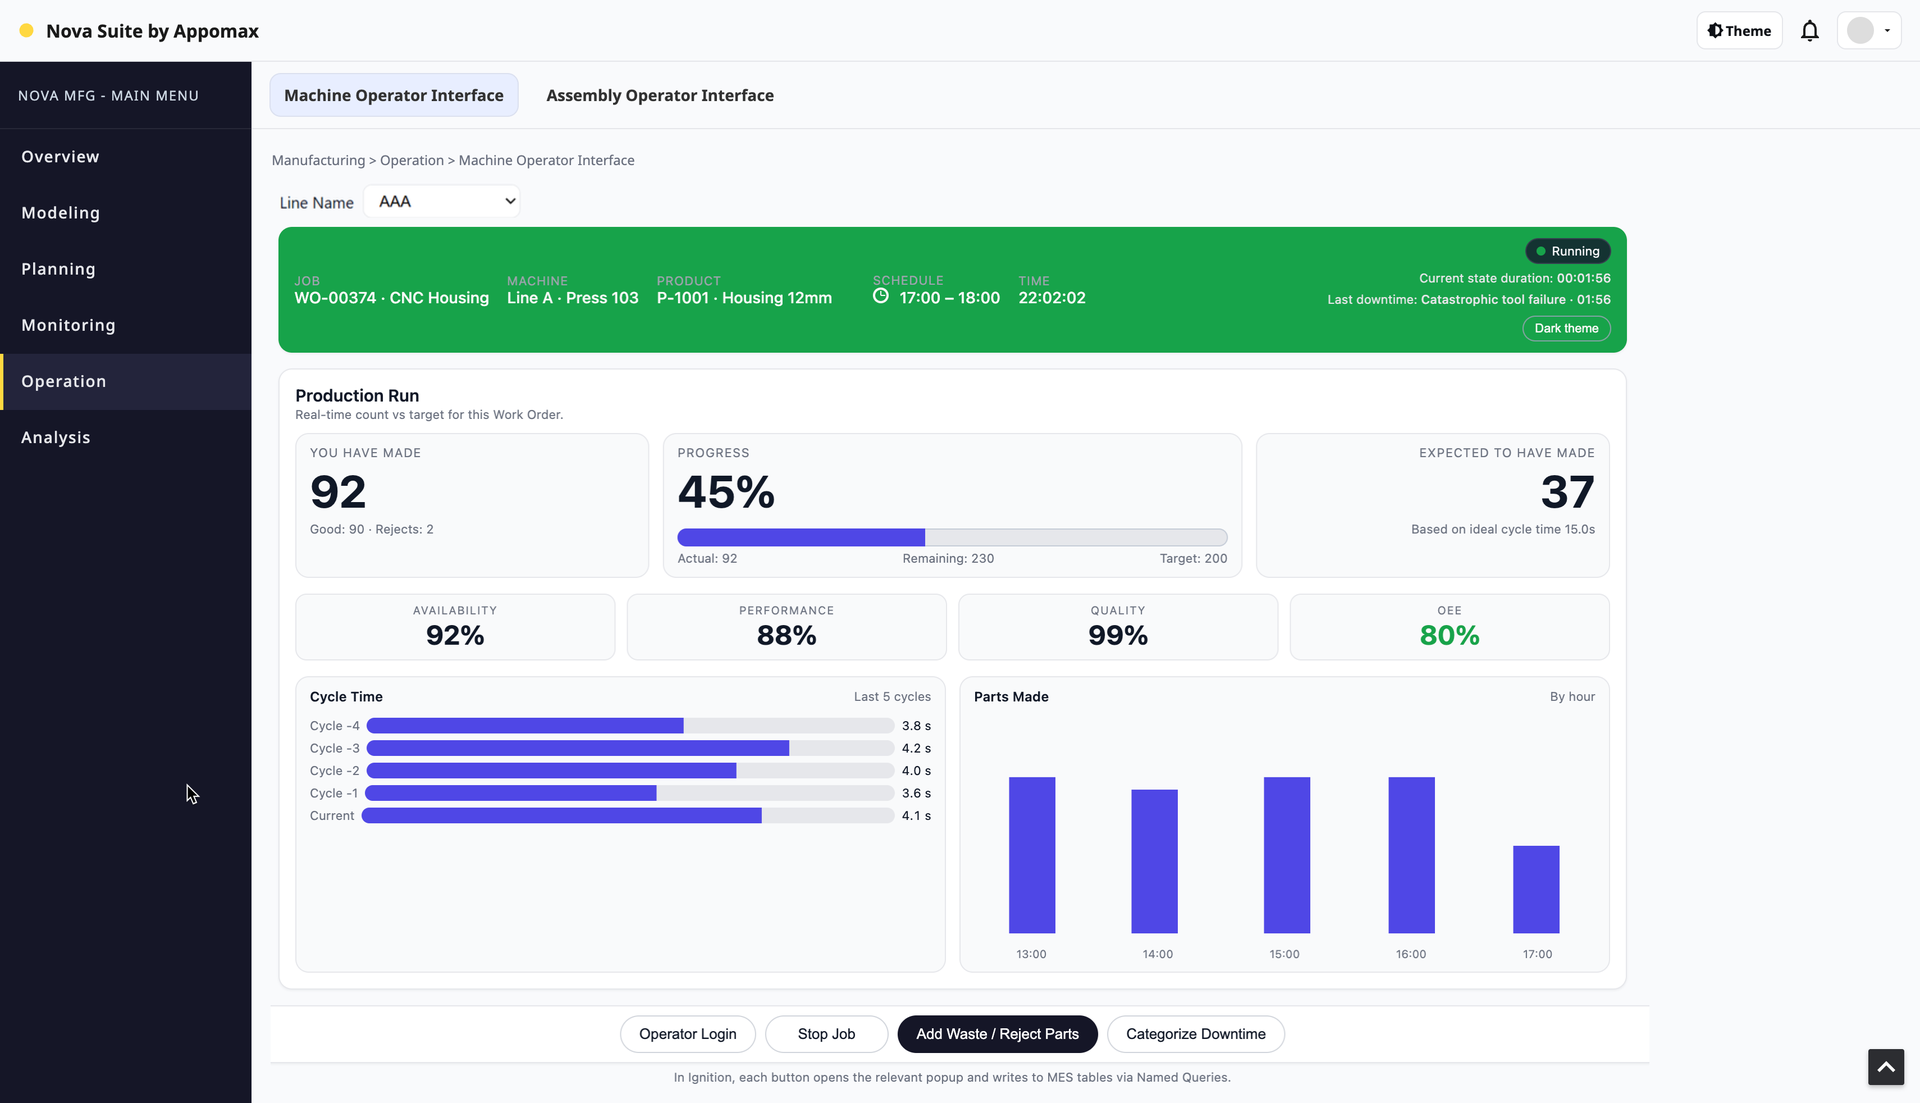
The Production Run Monitoring view provides real-time visibility into the current Production Run for a specific Line.
It displays up-to-date run context, production KPIs, OEE indicators, cycle-time behavior, hourly production trends, and operator actions (waste input, downtime categorization, run stop).
This view is data-driven entirely through UDT tags:
Realtime tags (5 seconds) from Line Runtime UDTs
Database aggregate tags (1 minute) delivered via SQL Query Tags inside the UI_RunMonitor UDT
Lookup tags provide human-readable wording (e.g., downtime reasons, product descriptions)
Command Tags (write-only) are used by Perspective to trigger run actions through the Dispatch UDT.
Perspective does not perform any direct SQL.
All database access is encapsulated inside the UI_RunMonitor UDT.
2. UDT Architecture
1. UDT Name & Purpose
UDT Name: UI_RunMonitor
One instance per Line, e.g.:
[default]UI/RunMonitor/Line01
[default]UI/RunMonitor/Line02
Purpose:
Provide a single tag interface for the Production Run Monitoring view:
Realtime machine + counter tags (≈ 5s)
Aggregated MES data from DB (≈ 60s, via SQL Query Tags)
UI-friendly scalar tags (strings, numbers) parsed from the datasets
Perspective only binds to this UDT. No direct SQL from the UI.
2. UDT Parameters
Might work UDT
| Parameter | Type | Example value | Used for |
| LineId | Int4 | 1 | DB queries (run, schedule, etc.) |
| LineName | String | LINE_01 | For display / logging |
| LinePath | String | [default]Runtime/Line01 | Path to Line-runtime UDT |
| DbConn | String | MES_Core | DB connection for SQL Query Tags |
3. Members – Realtime (5s)
These are Reference tags into your existing Runtime/Line UDTs.
Adjust the LinePath mapping to your actual structure.
Folder: Realtime
| Tag Name | Type | Source (where to get it from) | Notes |
| StateCode | Int4 | Reference: {LinePath}/State/Code | Current machine state |
| StateDuration | Int4/Int8 | Reference: {LinePath}/State/Duration | Seconds in current state |
| GoodCountLive | Int8 | Reference: {LinePath}/OEE/OutfeedCount or /Outfeed/Count | Live good count |
| WasteCountLive | Int8 | Reference: {LinePath}/OEE/WasteCount or /Waste/Count | Live waste count |
| RunId | Int8 | Reference: {LinePath}/OEE/RunId or /Run/Id | Active run ID |
| MachineName | String | Expression: {LineName} or ref from runtime UDT | For header display |
Scan class / rate:
Use your existing 5 s (or faster) scan class.
4. Members – DB (SQL Query Tags, 60s)
These are SQL Query Tags that go to the MES DB via connection {DbConn}.
Execution mode: Run every 60000 ms.
Folder: DB
4.1 RunHeaderData (Dataset)
Type: Query Tag (Dataset)
Rate: 60000 ms
DB Connection: {DbConn}
Parameter(s): :line_id = {LineId}
Purpose:
One-row dataset with all info for:
Work Order, Product, target qty
Actual good/reject/total
Remaining, progress %
Expected good (based on idealcycletime & runtime)
OEE (A, P, Q, OEE)
SQL (simplified from previous):
WITH active_run AS (
    SELECT
        r.id               AS run_id,
        r.schedule_id,
        r.total_count,
        r.good_count,
        r.waste_count,
        r.availability,
        r.performance,
        r.quality,
        r.oee,
        r.runtime,
        r.run_start_datetime,
        s.line_id,
        s.schedule_start_datetime,
        s.schedule_finish_datetime,
        s.quantity         AS target_qty,
        wo.id              AS work_order_id,
        wo.work_order      AS work_order_no,
        pc.product_code,
        pc.description     AS product_description,
        pcl.idealcycletime AS ideal_cycle_time_s
    FROM run r
    JOIN schedule       s   ON r.schedule_id      = s.id
    JOIN work_order     wo  ON s.work_order_id    = wo.id
    JOIN product_code   pc  ON wo.product_code_id = pc.id
    LEFT JOIN product_code_line pcl
           ON pcl.product_code_id = pc.id
          AND pcl.line_id         = s.line_id
    WHERE s.line_id = :line_id
      AND r.closed = FALSE
    ORDER BY r.run_start_datetime DESC
    LIMIT 1
)
SELECT * FROM active_run;
4.2 Last5CyclesData (Dataset)
Type: Query Tag (Dataset)
Rate: 60000 ms
Parameter: :run_id = {Realtime/RunId}
Source table: run_cycle_time
SELECT
    cycle_index,
    cycle_end_time,
    cycle_time_s
FROM run_cycle_time
WHERE run_id = :run_id
ORDER BY cycle_index DESC
LIMIT 5;
Used by the “Last 5 cycles” bar list.
4.3 PartsByHourData (Dataset)
Type: Query Tag (Dataset)
Rate: 60000 ms
Parameter: :run_id = {Realtime/RunId}
Source table: run_count_by_interval (or equivalent aggregation view)
SELECT
    bucket_start,
    bucket_end,
    good_count,
    waste_count,
    total_count
FROM run_count_by_interval
WHERE run_id = :run_id
ORDER BY bucket_start;
Used by the “Parts made – by hour” chart.
4.4 DowntimeDictionary (Dataset)
Type: Query Tag (Dataset)
Rate: 60000 ms
Source table: downtime_reason
SELECT
    code,
    short_text,
    long_text
FROM downtime_reason;
Used to turn a downtime code into wording text.
5. Members – UI / Parsed Values (Expression Tags)
These are scalar tags parsed from the datasets.
This is what Perspective typically binds to for labels, KPIs, etc.
Folder: UI/Header
| Tag Name | Type | Expression (where it reads from) | Purpose |
| RunIdActive | Int8 | {Realtime/RunId} | Convenience alias Used by KPI expressions, OEE tiles, and chart queries when parsing DB results. |
| WorkOrderNo | String | lookup("work_order_no", "run_id", {Realtime/RunId}, {DB/RunHeaderData}, "") | Header |
| ProductCode | String | lookup("product_code", "run_id", {Realtime/RunId}, {DB/RunHeaderData}, "") | Header |
| ProductDescription | String | lookup("product_description", "run_id", {Realtime/RunId}, {DB/RunHeaderData}, "") | Header |
| TargetQty | Int8 | lookup("target_qty", "run_id", {Realtime/RunId}, {DB/RunHeaderData}, 0) | KPIs |
| RuntimeSeconds | Int8 | lookup("runtime", "run_id", {Realtime/RunId}, {DB/RunHeaderData}, 0) | For expected calc |
| IdealCycleTime | Float8 | lookup("ideal_cycle_time_s", "run_id", {Realtime/RunId}, {DB/RunHeaderData}, 0) | For expected calc |
| ScheduleStartDT | DateTime | lookup("schedule_start_datetime", "run_id", {Realtime/RunId}, {DB/RunHeaderData}, now()) | Display |
| ScheduleFinishDT | DateTime | lookup("schedule_finish_datetime", "run_id", {Realtime/RunId}, {DB/RunHeaderData}, now()) | Display |
Folder: UI/KPI
| Tag Name | Type | Expression |
| ActualGood | Int8 | lookup("good_count", "run_id", {Realtime/RunId}, {DB/RunHeaderData}, 0) |
| ActualReject | Int8 | lookup("waste_count", "run_id", {Realtime/RunId}, {DB/RunHeaderData}, 0) |
| ActualTotal | Int8 | {UI/KPI/ActualGood} + {UI/KPI/ActualReject} |
| RemainingQty | Int8 | lookup("target_qty", "run_id", {Realtime/RunId}, {DB/RunHeaderData}, 0) - {UI/KPI/ActualGood} |
| ProgressPct | Float8 | if({UI/KPI/TargetQty} > 0, 100.0 * {UI/KPI/ActualGood} / {UI/KPI/TargetQty}, 0) |
| ExpectedGood | Int8 | if({UI/Header/IdealCycleTime} > 0, floor({UI/Header/RuntimeSeconds} / {UI/Header/IdealCycleTime}), 0) |
(You can also lookup pre-calculated expected_good_count if you store it directly in the SQL.)
Folder: UI/OEE
| Tag Name | Type | Expression |
| Availability | Float8 | lookup("availability", "run_id", {Realtime/RunId}, {DB/RunHeaderData}, 0) |
| Performance | Float8 | lookup("performance", "run_id", {Realtime/RunId}, {DB/RunHeaderData}, 0) |
| Quality | Float8 | lookup("quality", "run_id", {Realtime/RunId}, {DB/RunHeaderData}, 0) |
| OEE | Float8 | lookup("oee", "run_id", {Realtime/RunId}, {DB/RunHeaderData}, 0) |
Folder: UI/Downtime
| Tag Name | Type | Source / Expression |
| CurrentCode | Int4 | {Realtime/StateCode} |
| CurrentTextShort | String | lookup("short_text", "code", {UI/Downtime/CurrentCode}, {DB/DowntimeDictionary}, "") |
| CurrentTextLong | String | lookup("long_text", "code", {UI/Downtime/CurrentCode}, {DB/DowntimeDictionary}, "") |
Folder: UI/Charts
For charts and lists, you use the dataset tags directly:
| Tag Name | Type | Source | Note |
| CyclesLast5 | Dataset | {DB/Last5CyclesData} | Bind to repeater / flex repeater |
| PartsByHour | Dataset | {DB/PartsByHourData} | Bind to chart (X = bucket_start) |
No parsing needed here; just use the full dataset.
6. How Perspective Uses This UDT
Header bar
Binds to UI/Header/* and UI/Downtime/* tags.
KPI row
Binds to UI/KPI/*.
OEE strip
Binds to UI/OEE/*.
Last 5 cycles
Repeater data source = UI/Charts/CyclesLast5.
Parts made – by hour
Chart data source = UI/Charts/PartsByHour.
Action buttons / popups
Use {Realtime/RunId}, {LineId}, {LineName} as parameters to Gateway scripts / Named Queries.
3. Page Structure and Workflow
The View binds exclusively to tags under:
[default]UI/RunMonitor/{Line}
3.1 Header Bar (Live Run Context)
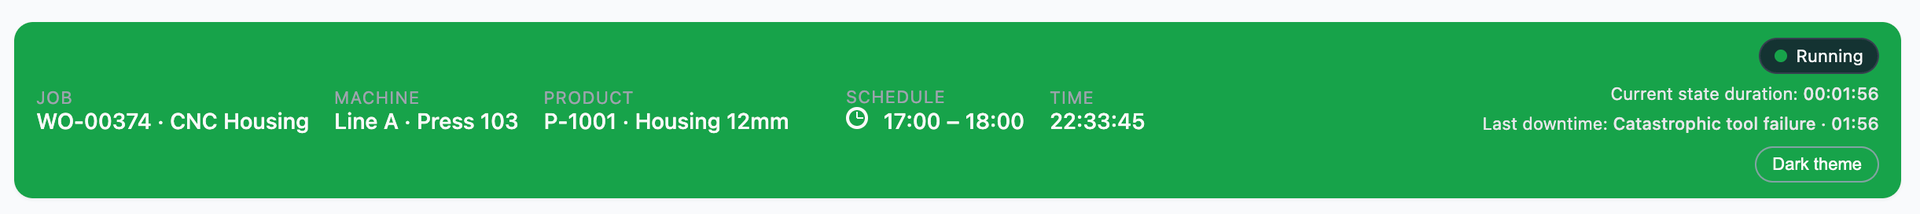
Shows Work Order, Product, State, Machine Name, Downtime wording, Run Start Time.
Bindings:
Work Order No → WorkOrderNo
Product Code & Description → ProductCode, ProductDescription
Machine State → StateCode, StateDuration
Downtime wording → DowntimeText
Scheduled Start/End → lookup from RunHeaderData
Refresh behavior:
State code & duration: every 5s
Context info: every 60s
3.2 Production KPI Row
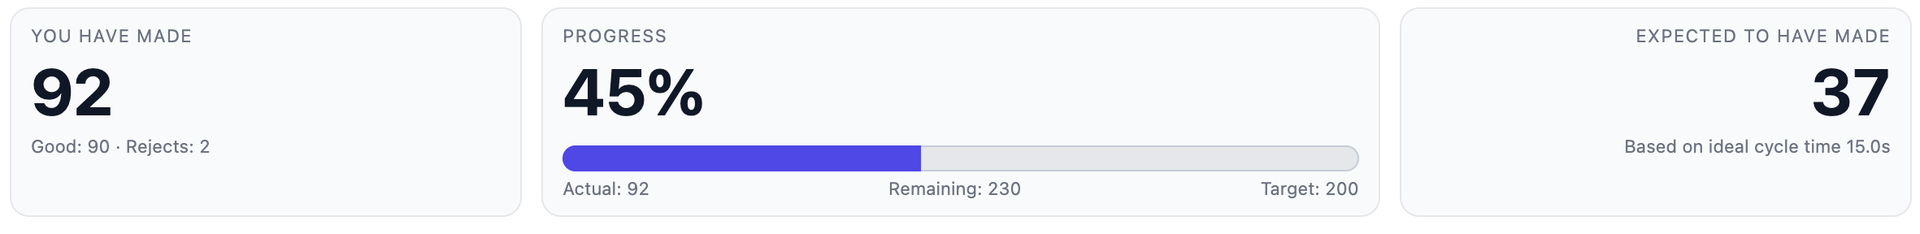
Contains the following tiles:
(A) You Have Made
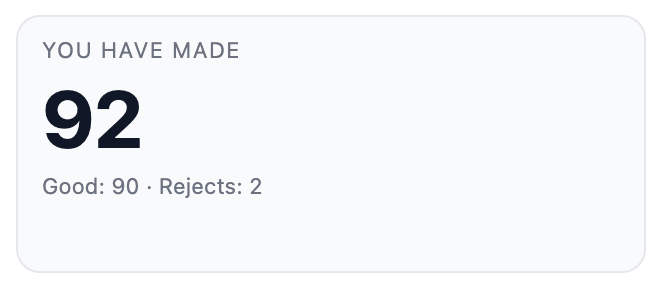
Good → ActualGood
Reject → ActualReject
Total = (Good + Reject)
(B) Progress
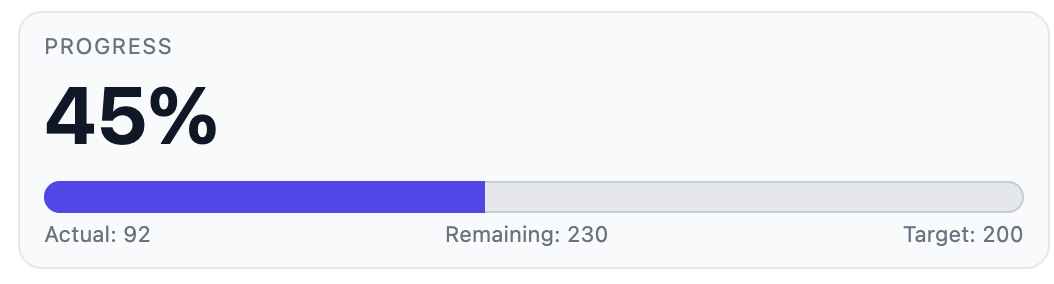
Remaining Qty → RemainingQty
Progress % → ProgressPct
(C) Expected to Have Made
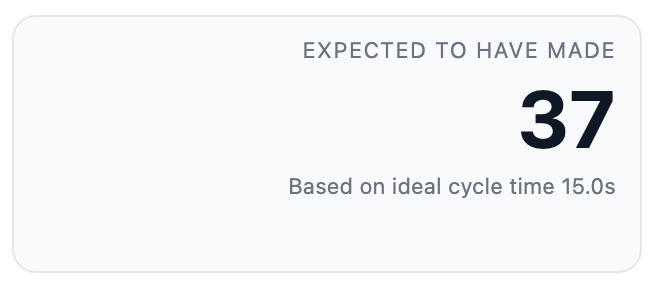
Expected Good → ExpectedGood
Refresh behavior:
From RunHeaderData → 60s
3.3 OEE Strip

Mobile responsive view
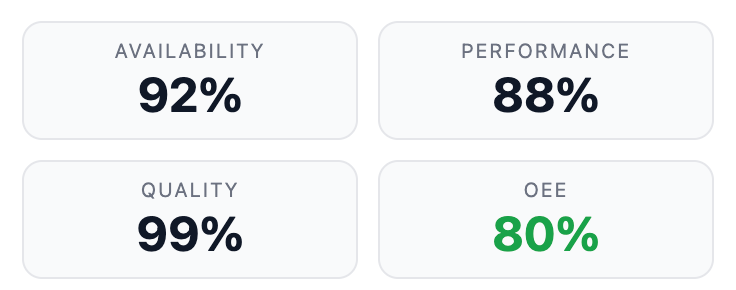
Tiles: Availability / Performance / Quality / OEE
All values → lookup from RunHeaderData (Expression Tags).
Refresh rate: 60s
3.4 Cycle Time – Last 5 Cycles
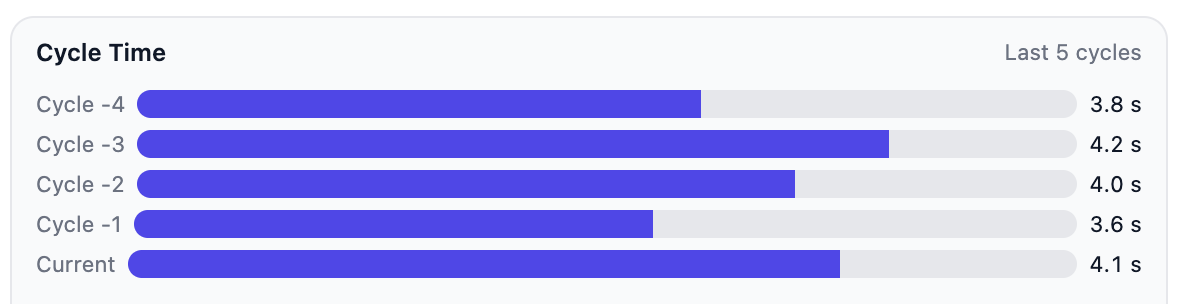
Horizontal bar chart.
Bind repeater to:
Last5CyclesData
Refresh: 60s
For each cycle row:
Actual cycle time: {cycle_time_s}
Ideal cycle: from lookup {ideal_cycle_time_s}
Percentage bar width computed in Perspective transform:
min(100, 100 * cycle_time_s / ideal_cycle_time_s)
3.5 Hourly Parts Made Chart
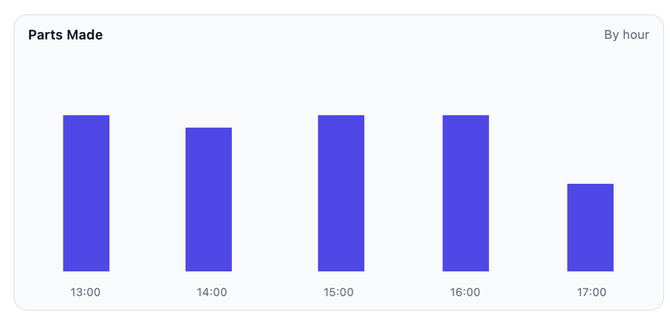
Bind chart directly to:
PartsByHourData
Refresh: 60s
Columns:
bucket_start (X-axis)
good_count (bar height)
Optional: waste_count, total_count
3.6 Action Buttons
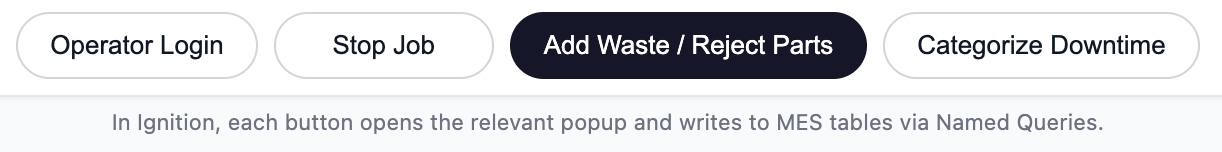
Buttons trigger Perspective popup views and write to Command Tags in the UI_RunMonitor UDT. Dispatch UDT scripts handle all database writes and run-state transitions.
Updated Action Button table:
| Action | Behaviour |
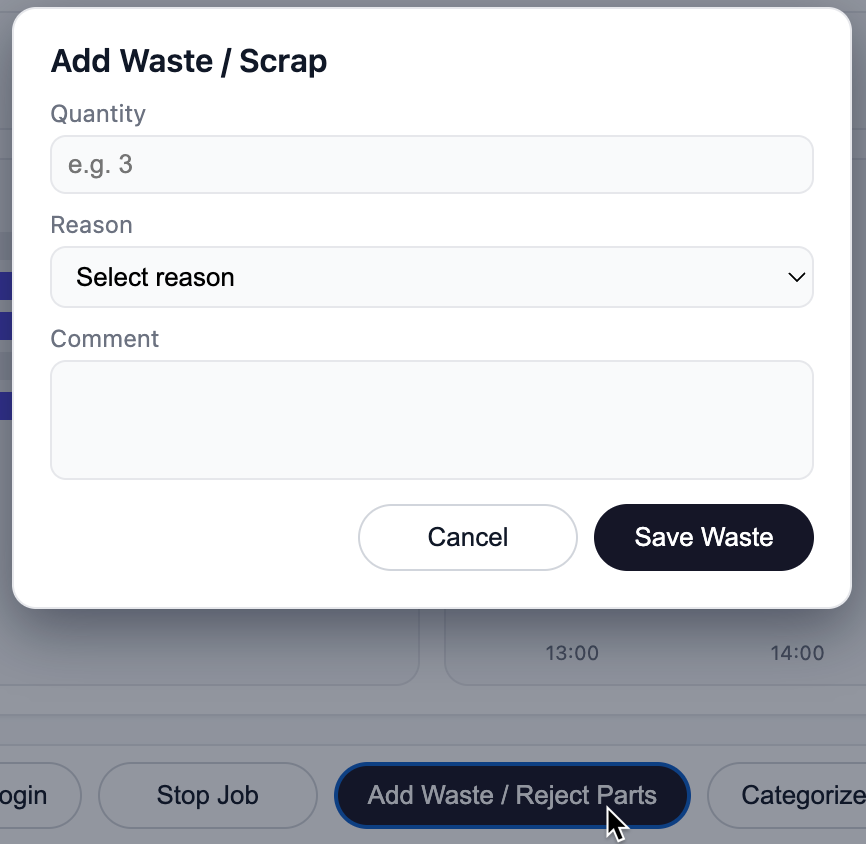
| Add Waste | Opens popup → writes values to UI_RunMonitor.Commands.Waste* tags → Dispatch UDT handles the DB insert + counter update |
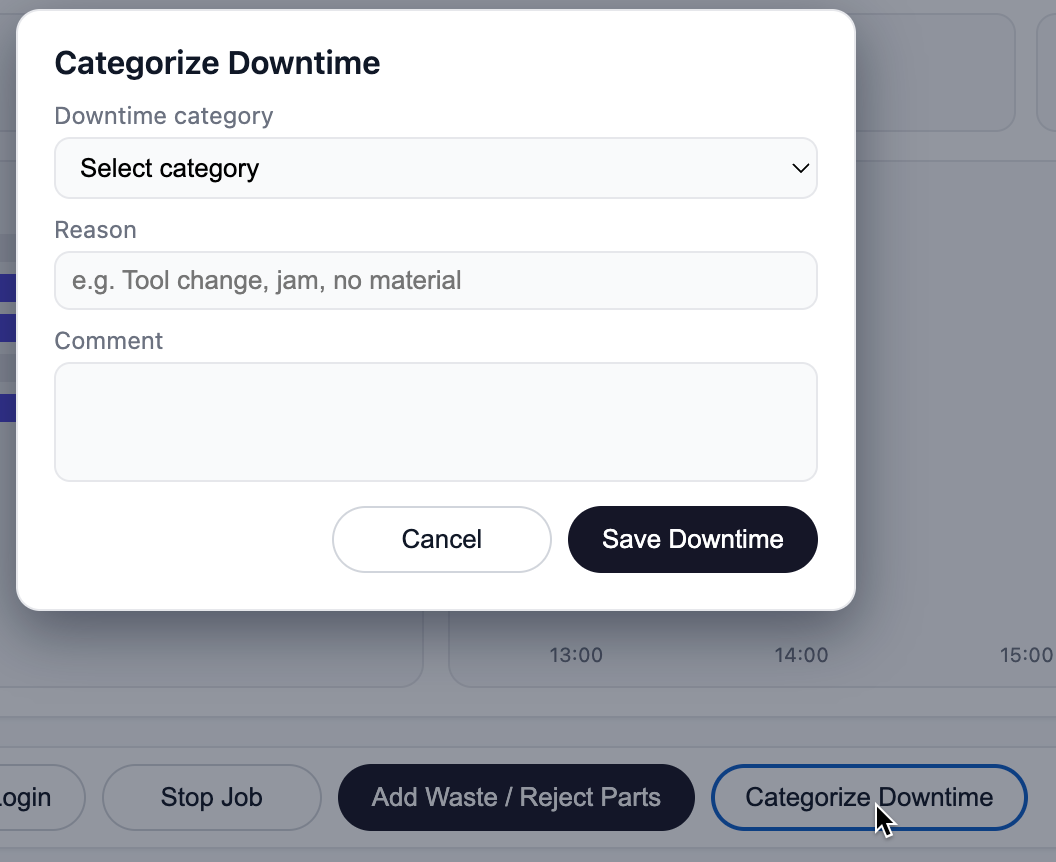
| Downtime Categorization | Opens popup → writes values to UI_RunMonitor.Commands.Dt* tags → Dispatch UDT handles downtime logging |
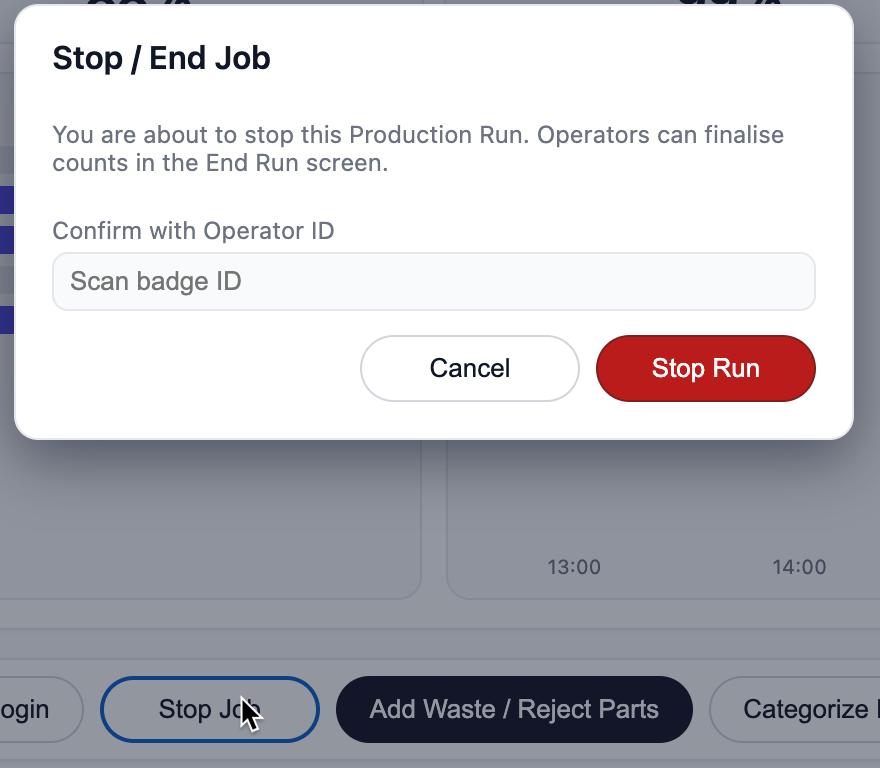
| Stop Run | Opens popup → sets UI_RunMonitor.Commands.EndRunTrigger → Dispatch UDT closes run & writes final DB summary |
| Operator Login | Same operator login popup as 4.1.1 (handled by Security/Login UDT) |
This is the only correction needed for functional correctness.
UDT values (RunId, LineId) may be referenced by Dispatch UDT scripts. Perspective does not pass parameters to gateway scripts.
4. Command Tag Integration with Dispatch UDT
These Query Tags are strictly read-only and are used only to retrieve MES data for the UI.
All write operations (waste, downtime, end run) are handled by the Dispatch UDT
Perspective popups do not write to the database.
They only write to command tags in the UI_RunMonitor UDT, which are mapped 1:1 to the existing Dispatch UDT command tags.
The existing Dispatch scripts are responsible for updating the Run UDT and the MES database.
4.1 Command Tag Mapping Structure (Required)
To make the documentation complete, explicitly declare the command tags:
Command Tags Inside UI_RunMonitor (Reference → Dispatch)
Inside the Commands folder:
| UI Tag | Type | Source / Mapping |
| Commands/WasteQty | Int | Reference → {LinePath}/Dispatch/CmdWasteQty |
| Commands/WasteReason | String | Reference → {LinePath}/Dispatch/CmdWasteReason |
| Commands/WasteComment | String | Reference → {LinePath}/Dispatch/CmdWasteComment |
| Commands/WasteTrigger | Bool | Reference → {LinePath}/Dispatch/CmdWasteTrigger |
| Commands/DtCategory | String | Reference → {LinePath}/Dispatch/CmdDtCategory |
| Commands/DtReason | String | Reference → {LinePath}/Dispatch/CmdDtReason |
| Commands/DtComment | String | Reference → {LinePath}/Dispatch/CmdDtComment |
| Commands/DtTrigger | Bool | Reference → {LinePath}/Dispatch/CmdDtTrigger |
| Commands/EndRunOperatorId | String | Reference → {LinePath}/Dispatch/CmdEndRunOperatorId |
| Commands/EndRunTrigger | Bool | Reference → {LinePath}/Dispatch/CmdEndRunTrigger |
All commands in the Production Run Monitoring view are executed by writing values into these tags.
The Dispatch UDT monitors these tags and performs:
MES database writes
Run state transitions
Waste/downtime capture
End Run finalisation
5. Ignition Implementation Requirements
UDTs
UI_RunMonitor (new)
Existing runtime UDT (Line) referenced via LinePath
Tag Types
| Type | Frequency | Purpose |
| Reference Tags | 5s | Machine state + live counters |
| SQL Query Tags | 60s | Run summary, OEE, cycles, hourly data |
| Lookup Tags | 5s–60s | Human-readable mappings |
Perspective Bindings
Entire view binds only to UDT tag paths
No Named Query bindings
Charts and repeaters receive dataset tags
6. Summary
The Production Run Monitoring view is implemented using a hybrid tag-driven model:
Realtime behaviour comes from runtime UDTs (5s)
Aggregated MES data comes from SQL Query Tags (60s)
No direct DB calls from Perspective
The view becomes completely tag-driven, easy to maintain, consistent, and high performance